

When we launched the Dealer Meetup Series, the goal was simple: create a space for real...
How Much Should a Dealer Offer a Private Seller? 200,000 Offers Answer

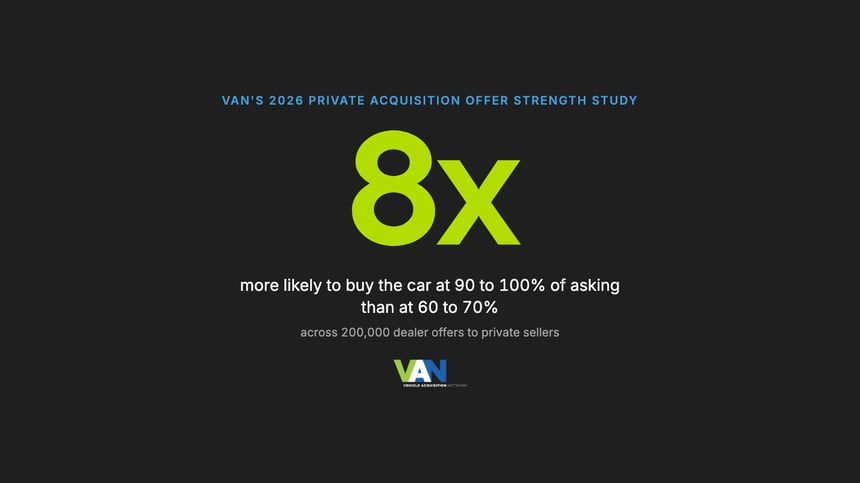
A dealer offering a private seller 90 to 100 percent of the asking price buys that car about one time in 22. A dealer offering 60 to 70 percent buys it about one time in 175. The stronger offer buys the car eight times as often, and that is the finding of VAN's 2026 Private Acquisition Offer Strength Study: more than 200,000 human-written dealer offers on 167,665 private-party listings, January 2025 through August 2026, logged by Vehicle Acquisition Network (VAN). How much a dealer should offer a private seller is a curve, not a cliff, and from about 70 percent of asking price, each ten points closer to asking is another step up. The offer is one of eight things that decide whether the car gets bought, and it is the only one this study measures.
The short version
- Know your number. The network median offer is 77 percent of asking price. Pull your buyer's last 30 offers and find yours. The curve
- Move it ten points closer to asking on the cars that fit, say from 77 percent to 87. In the month-to-month data, a store's median offer ten points closer to asking went with three or four more cars for every 100 private-seller listings it made an offer on. Loose fit, not a forecast. The math
- Fit, follow-up, the appointment, and four other things also decide whether the car gets bought. This study did not measure them. The other seven
Full steps: What to do with it on Monday
How acquisition rate rises with the offer-to-ask ratio
Every store in VAN's 2026 Private Acquisition Offer Strength Study uses the VAN platform. In own-staff stores, the dealership's own people write the offers and work the sellers. Stores with a VAN Managed Buyer™ also have a full-time buyer VAN supplies to work the store's market on the store's behalf. Acquisition rate climbs with the offer, band by band, for both.
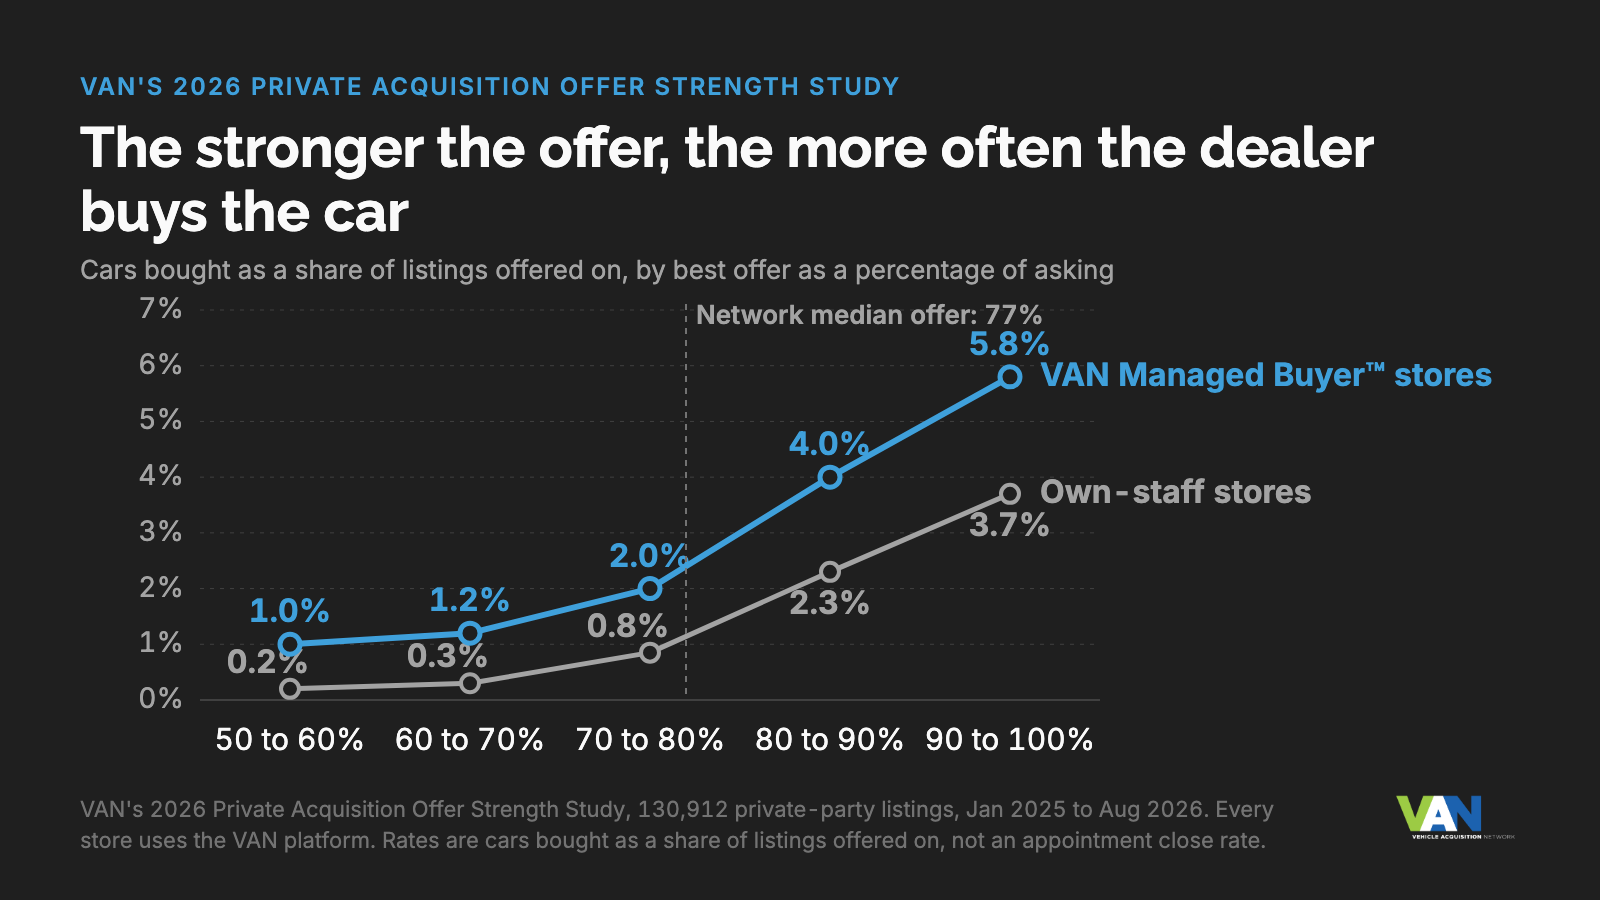
Acquisition rate by best offer as a percentage of asking price
| Best offer as a percentage of asking price | VAN Managed Buyer™ stores | Own-staff stores |
|---|---|---|
| 50 to 60% | about 1% | about 0.2% |
| 60 to 70% | about 1.2% | about 0.3% |
| 70 to 80% | about 2% | about 0.8% |
| 80 to 90% | 4.0% | 2.3% |
| 90 to 100% | 5.8% | 3.7% |
Source: VAN's 2026 Private Acquisition Offer Strength Study, January 2025 to August 2026. 167,665 private-party listings received a human dealer offer; the 130,912 with a best offer between 50 and 100 percent of asking are shown, and listings outside that range are left out. More on the sample is in How we counted.
At 80 to 90 percent of asking, VAN Managed Buyer™ stores acquired 4.0% of offered listings and own-staff stores 2.3%. At 90 to 100 percent, the rates were 5.8% and 3.7%.
Two things jump out. The slope is steep from 70 percent of asking up. And the median human offer across the VAN network from January 2025 through August 2026 was 77 percent of asking price, with store medians running from 69 to 85 percent, right where the curve starts to climb.
One thing the ratio is not: a dollar target. Private sellers list at retail or above it, and you still buy to cost-to-market. The ratio is relative. An offer at 85 percent of asking on a car listed at book is a different deal than 85 percent on one listed $3,000 over it, and your ACV ceiling on the appraisal sets the top of what you can write either way. The question this study answers is where your best offer lands as a share of the seller's asking price, under that ceiling, and what each ten points closer to asking is worth.
How VAN measured offer strength
VAN logs the offers dealers send private sellers through the platform and the listings that become acquisitions. We took every offer a person wrote since January 2025, on accounts active when the data was pulled in September 2026, that had a usable asking price attached, more than 200,000 of them. The exact counts are in How we counted at the bottom. For each listing we took the best human offer, divided it by the seller's asking price, and asked one question: did the store buy the car? Then we grouped the listings into bands ten points wide.
The denominator is every listing offered on, including the sellers who never answered, sold it to the neighbor, or pulled the ad. It is not a show rate. Read the percentages as a share of listings offered on, not a share of sellers who came in.
What is an offer ten points closer to asking worth?
Comparing stores to each other invites an obvious objection: the store that offers more probably also has the better process, the better market, or the better manager on the desk. So we looked inside each store, month by month.
Same store, different months
In months when a store's median offer ran ten points closer to asking, the store bought three or four more cars for every 100 listings it made an offer on (three to four percentage points on acquisition rate). Loose fit. Direction, not a forecast.
The comparison runs month by month inside each store, and the fit is loose: the offer ratio explains roughly a tenth of a store's month-to-month swing in acquisition rate, and the other nine tenths is month-to-month chance plus everything the study did not measure, starting with the other seven factors. It is also a bigger step than the chart shows for one band up, which is about one to two cars per 100 listings. Same direction either way, and a strong-offer month is probably also a month when more than the offer went right. The numbers behind the fit are in How we counted.
You only pay the extra on the cars you actually buy, not on every listing you offered on.
Stores with a VAN Managed Buyer™ buy the car more often at every offer level
At every offer level, stores with a VAN Managed Buyer™ bought the car more often than own-staff stores. 4.0% versus 2.3% at 80 to 90 percent of asking. 5.8% versus 3.7% at 90 to 100. Same offer band. We did not measure show rate in this study, so the data does not say why. It could be that VAN Managed Buyer™ stores choose better listings to offer on, or that the stores that add one differ in ways we did not measure. Our read is that the difference is what happens after the offer goes out: the second and third touch, the appointment set, the seller who shows. That follow-up is the job of a vehicle acquisition specialist, in-house or outsourced.
We would expect a store's own in-house buyer with the same follow-up discipline to see the same shape. The data does not test that. If it holds, the two stack. The offer moves you up the curve. Follow-up moves the curve.
What to do with it on Monday
- Know your number. Pull your buyer's last 30 private-party offers and divide each by the seller's ask. A median under 70 percent of asking means you are on the flatter part of the curve. The network median is 77 percent.
- Move it ten points, on purpose. Not on every car. On the cars that fit your buy box and turn. A ten-point move on a $15,000 asking price is $1,500, and in the data, listings offered at 80 to 90 percent of asking were bought about two and a half times as often as listings offered at 70 to 80 percent. Before you book that as lost gross, price the alternative: the same car at the lane carries a buy fee, transport, and a week or more before it is front-line ready, and you are bidding against every store in the region for it. And you only pay the extra on the cars you actually buy, not on every listing you offered on. That is a handful per 100 listings. Your appraisal is still the ceiling.
- Lead with your highest and best. Every desk was taught to leave room. That works on a trade, where the customer is in your showroom and you get a second swing. A private seller is not in your showroom. They have a listing up, other calls coming in, and no reason to answer a number that reads as an insult. In our experience a low opener does not start a negotiation; it ends the contact, and you never find out why. The study measures the best offer on each listing, so it cannot prove opening high beats opening low and bumping later. From the desk, the bump rarely gets a chance to happen. If you have a manager who pulls every offer back $500 before it goes out, read this first. One buyer who works this way hits 50 cars a month by leading with his strongest number.
- Get the appointment in week one. The offer gets you the conversation. The first-week appointment gets the car on your lot.
Want to see what this looks like in your market? Book a demo and we will walk the private-party listings in your radius with you.
What else decides whether the car gets bought
Eight things decide whether a dealer buys a car from a private seller: fit, the offer, the buyer on the phone, follow-up, the seller's position, the appointment, the desk holding the number, and the paperwork. VAN's 2026 Private Acquisition Offer Strength Study measured one of them, the offer. From working with dealer buy centers, the same eight come up store after store:
- Fit: whether the car is in the store's buy box and can be bought at a number that works on cost-to-market. No fit, no offer.
- The offer: how close it sits to what the seller asked, and whether it opens at the store's highest and best.
- The buyer on the phone: how fast the first call goes out, and whether the buyer can get a stranger with other calls coming in to agree to bring the car to you.
- Follow-up: what happens after the first offer. The second and third touch, and how long a seller's reply sits before someone answers it.
- The seller's position: how long the car has been listed, what other numbers they already have in hand, and whether there is a payoff the offer has to clear.
- The appointment: whether one gets set, whether the seller shows, and how the store treats them when they do.
- The desk holding the number: how fast the car is looked at, whether it matches the listing, and whether the buyer's number stands or gets cut at the door.
- The paperwork: title in hand or a lien, and the days between yes and keys.
The offer and the follow-up earn the appointment. The appraisal and the paperwork earn the car.
This study measures the offer directly, because it is the one variable we could measure cleanly on every listing in the sample, and a number the operator sets on purpose. It also shows a gap between VAN Managed Buyer™ stores and own-staff stores, which we read as follow-up and appointments, but it did not measure follow-up itself. It does not rank the eight. Ranking them would take a different study, one that measures follow-up, appointments, and appraisal speed on the same listings, and nothing here says the offer is the biggest of them. A store that treats the offer as the whole answer will be disappointed.
The study also does not say a strong offer fixes a broken buy center process. Stores with generous offers and no appointment on the calendar buy very little, and stores that pair a disciplined offer with a fast appraisal and a completed first-week appointment put up numbers the curve alone does not explain. The chart also cannot see the three things that kill the deal after the seller says yes: the lien payoff that takes ten days, the car that shows up two grades below the listing photos, and the seller who confirms Tuesday and does not show Saturday. The offer and the follow-up earn the appointment. The appraisal and the paperwork earn the car.
Four limits on the data. First, it is observational. Stores chose their own offers, nobody was assigned a number, so the curve shows what went together, not what caused what. Second, the best offer on a listing is partly set by the negotiation. A store raises its offer on the cars it is close to winning, so some of the listing-level slope is the deal pulling the offer up rather than the offer pulling the deal in. The month-to-month comparison inside a store is less exposed to that, because a store's monthly median is set mostly by the offers that never converted, which is why it is the number we lean on, but it is not immune. Third, the asking price is the listing's price at its last update. A seller who cut the price after the offer went out shows up with a stronger ratio than the buyer actually wrote. Fourth, the data covers stores active when the data was pulled. Stores that left the network are not in it, so the rates lean toward stores that made private-party buying work.
Frequently asked questions
How much should a dealer offer a private seller?
Offer your highest and best on the cars you want, and know your store's median. In VAN's 2026 Private Acquisition Offer Strength Study, acquisition rate rose steadily from about 70 percent of asking price up to full ask, and in the month-to-month data a store's acquisition rate ran three to four percentage points higher in months when its median offer was ten points closer to asking. The network median is 77 percent of asking price; store medians run from 69 to 85 percent. The offer is one of eight factors in whether the car gets bought. This study measured the offer only and does not rank it against the other seven.
What percentage of private-party offers turn into a purchase?
In VAN's 2026 Private Acquisition Offer Strength Study, a typical store converts about 1.3% of the listings it offers on in a given month. Across all stores, listings offered at 60 to 70 percent of asking were acquired about one time in 175, and listings offered at 90 to 100 percent about one time in 22, or about 4.5% of the time. That is eight times as often.
What is a good offer-to-asking-price ratio when buying a car from a private seller?
In VAN's 2026 Private Acquisition Offer Strength Study, listings that drew a best offer of 90 to 100 percent of asking price were acquired 5.8% of the time at VAN Managed Buyer™ stores and 3.7% at own-staff stores. The network median offer is 77 percent of asking price, and stores under 70 percent are working the flatter part of the curve. A high asking price is not a reason to skip the car; it is the number the seller judges your offer against. Track your offer as a share of asking alongside your cost-to-market, not as a bare dollar figure.
Does a dedicated buyer improve private-party acquisition rate?
Stores with one bought the car more often, yes. In VAN's 2026 Private Acquisition Offer Strength Study, stores with a VAN Managed Buyer™, a full-time buyer VAN supplies to work the store's market, bought the car more often than own-staff stores, at every offer level: 4.0% versus 2.3% at 80 to 90 percent of asking, and 5.8% versus 3.7% at 90 to 100 percent. The study did not test why. VAN's read is follow-up, and it could also be which listings those stores choose to offer on; the data cannot separate the two.
Is the offer the most important factor in buying a car from a private seller?
Not necessarily, and VAN's 2026 Private Acquisition Offer Strength Study does not claim it is. The study measured one factor, the offer, and found acquisition rate rises with each ten points the offer moves closer to asking, from about 70 percent of asking price up. It did not measure fit, the buyer on the phone, follow-up, the seller's position, the appointment, the desk holding the number, or the paperwork on the same listings, so it cannot rank the offer against them. What the data does show is that VAN Managed Buyer™ stores bought the car more often than own-staff stores at every offer level, so the number in the offer is not the whole story.
How we counted
VAN's 2026 Private Acquisition Offer Strength Study covers January 2025 through August 2026 on accounts active when the data was pulled in September 2026. The platform held 308,825 offers in that window. We removed 51,288 written by the platform's automation rather than a person, dropped 48,486 more with no usable asking price, and kept 209,051 human-written offers on 167,665 private-party listings. The chart and table show the 130,912 listings whose best offer fell between 50 and 100 percent of asking. Every band holds at least 4,000 listings in each store group. Rates below 80 percent of asking are read from the study chart to the nearest tenth of a percentage point. The month-to-month fit compares each store against itself across months; the correlation is r = 0.32, so the offer ratio explains roughly a tenth of a store's month-to-month swing in acquisition rate. The base rate, 1.3%, is the typical store-month share of offered listings that turned into a purchase, so three to four percentage points of acquisition rate is a large move against it, and about twice the step the chart shows for the same ten points of offer. We read the difference as everything else that goes right in a strong-offer month. For every 100 listings a store makes an offer on in a month, a median offer ten points closer to asking goes with three or four more cars bought. Read that as direction and rough size, not a forecast.